STRK, October 2026: what moved the price and what the chain shows
 Published by Rubén Planes Llinares on .
Chapter 1 of the series On-chain analysis of projects and tokens.
First chapter of this series of on-chain analyses of projects and tokens. Using public exchange data and two chains, I reconstruct what moved the STRK price in October 2026 and where the supply that reached an account attributed to an unidentified exchange in the hours after the peak came from.
Summary: the start was not the market embracing the idea
Scope notice: this is an analysis based on public on-chain and market data. Relationships between addresses are inferences, with the degree of certainty stated in each case. No unlawful conduct is attributed to any person or entity. It is not a forensic expert report and not investment advice. It was not commissioned or paid for by anyone.
Between the morning of 8 October and the night of the 11th, Starknet's STRK token went from $0.049 to $0.1266, a 157% rise. Since then it has fallen 56%, to $0.056, 14% above where it traded before the first headline. Social media and news outlets first read it as the market embracing the idea of turning Starknet into a post-quantum L1, and later as a rug pull. The data does not support the first reading: the rise was not started by the market but by three orders, in all likelihood automated. And in the hours after the peak, 60 million STRK reached an account attributed to an exchange from a wallet I attribute with high certainty to the Foundation's allocation, through eight transfers recorded on-chain.
All times in this analysis are UTC and every figure comes from public sources: the Binance, Bybit, Hyperliquid and Bithumb APIs, and Ethereum and Starknet RPC nodes. I do not identify natural persons. I do attribute wallets to the Foundation's allocation, with the degree of certainty I state.
- The 8 October rise was started by three buy orders on the Binance perpetual, in all likelihood automated, 14 minutes and 44 seconds after the StarkWare CEO's post: $584,000 in 18 seconds. The rest of the day was leverage following leverage.
- On 9 October there was speculative demand in the ordinary sense: thousands of mid-size orders, $3.65M of net spot buying, Korea arriving, and a short squeeze on top.
- The fall was leverage unwinding: the crowd was short at the top and long at the bottom, with open interest near the window's maximum at half the price. The 15 October token unlock did not start it.
- Underneath all of that, the chain shows a six-hop transfer route from a wallet that received one of the two halves of the Starknet Foundation's allocation to an account that I attribute, by its pattern, to an unidentified exchange. Its largest batch, 60 million STRK, arrived between 01:35 and 01:50 on the 12th. A deposit is not a sale, and I do not know who operates the intermediate accounts.
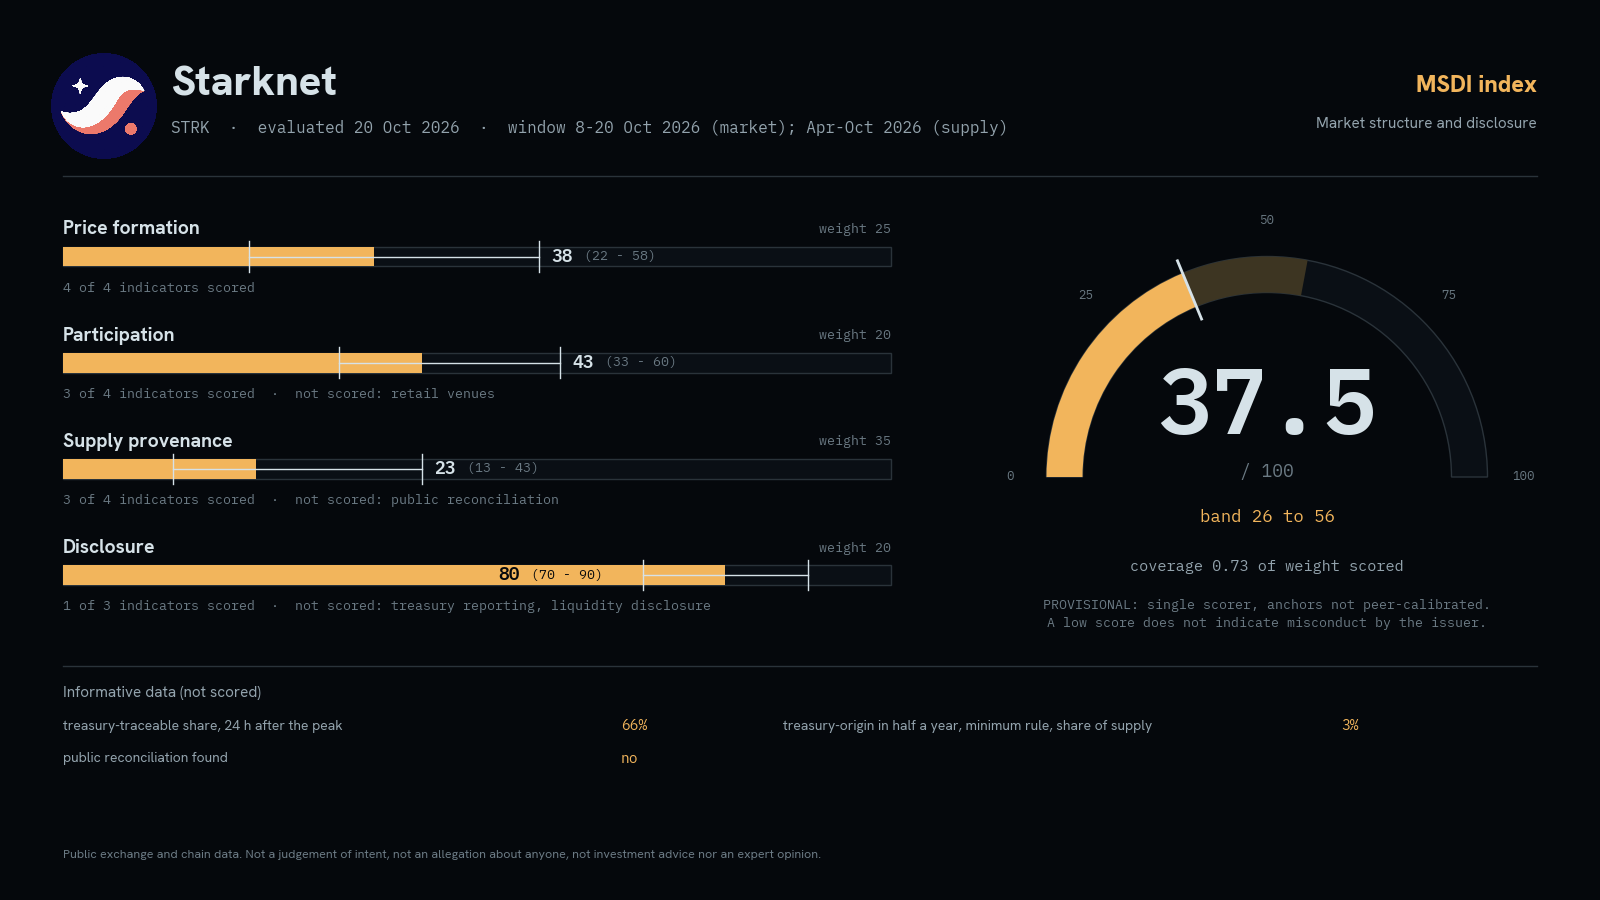
- A scoring index designed so that these questions get answered the same way for any token gives Starknet a provisional profile of 37.5 out of 100, with a band of 26 to 56.
8 October: fourteen quiet minutes and three sweeps
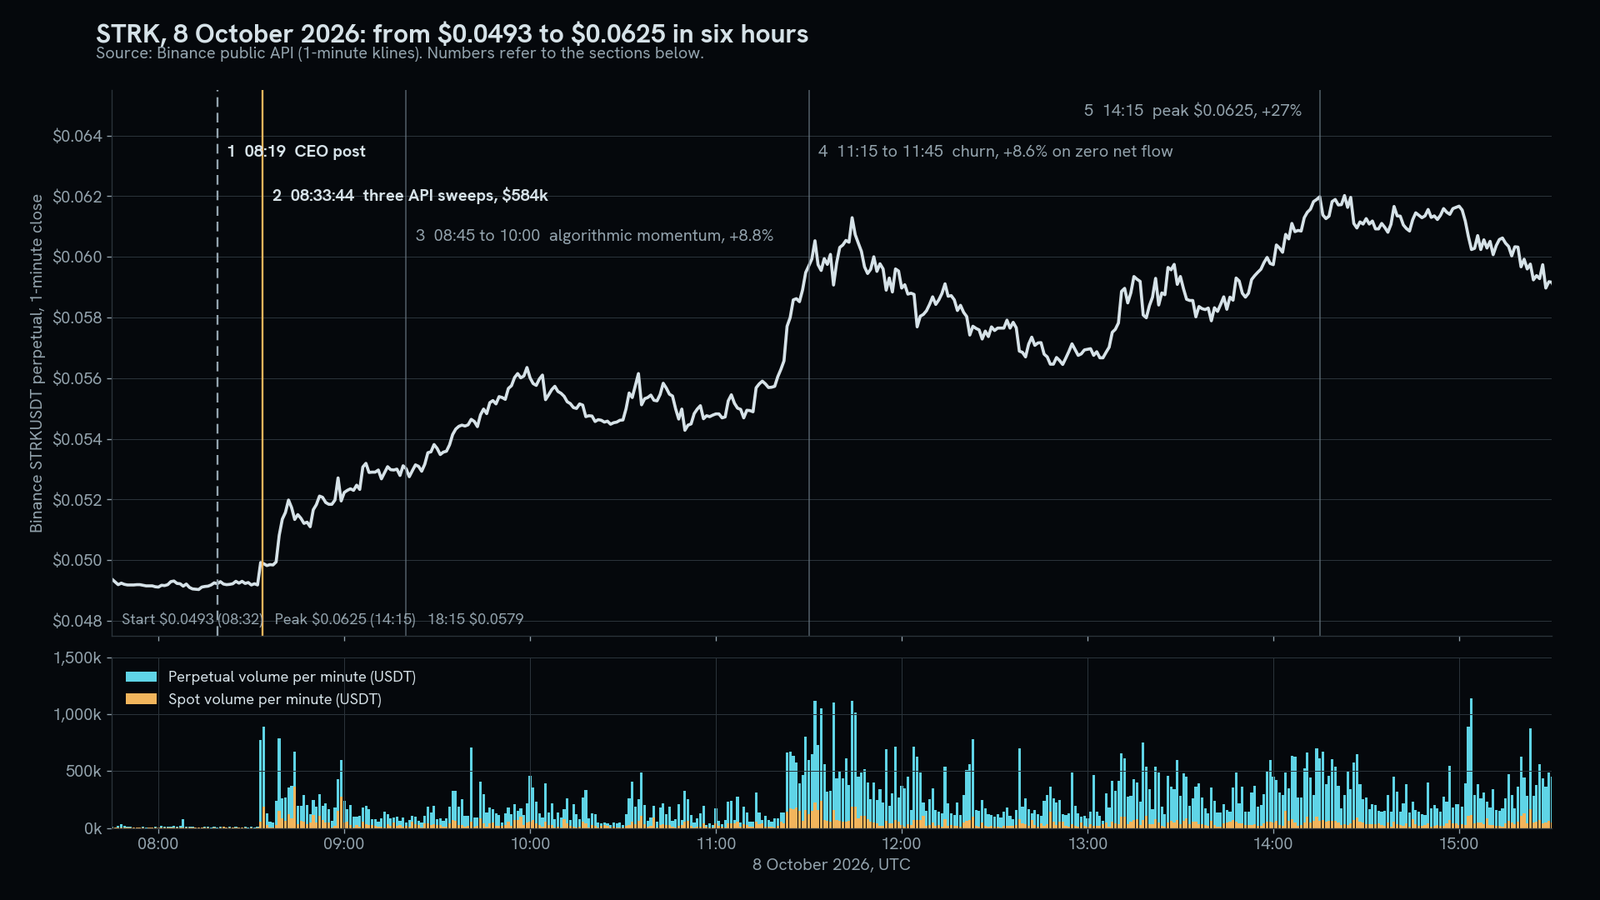
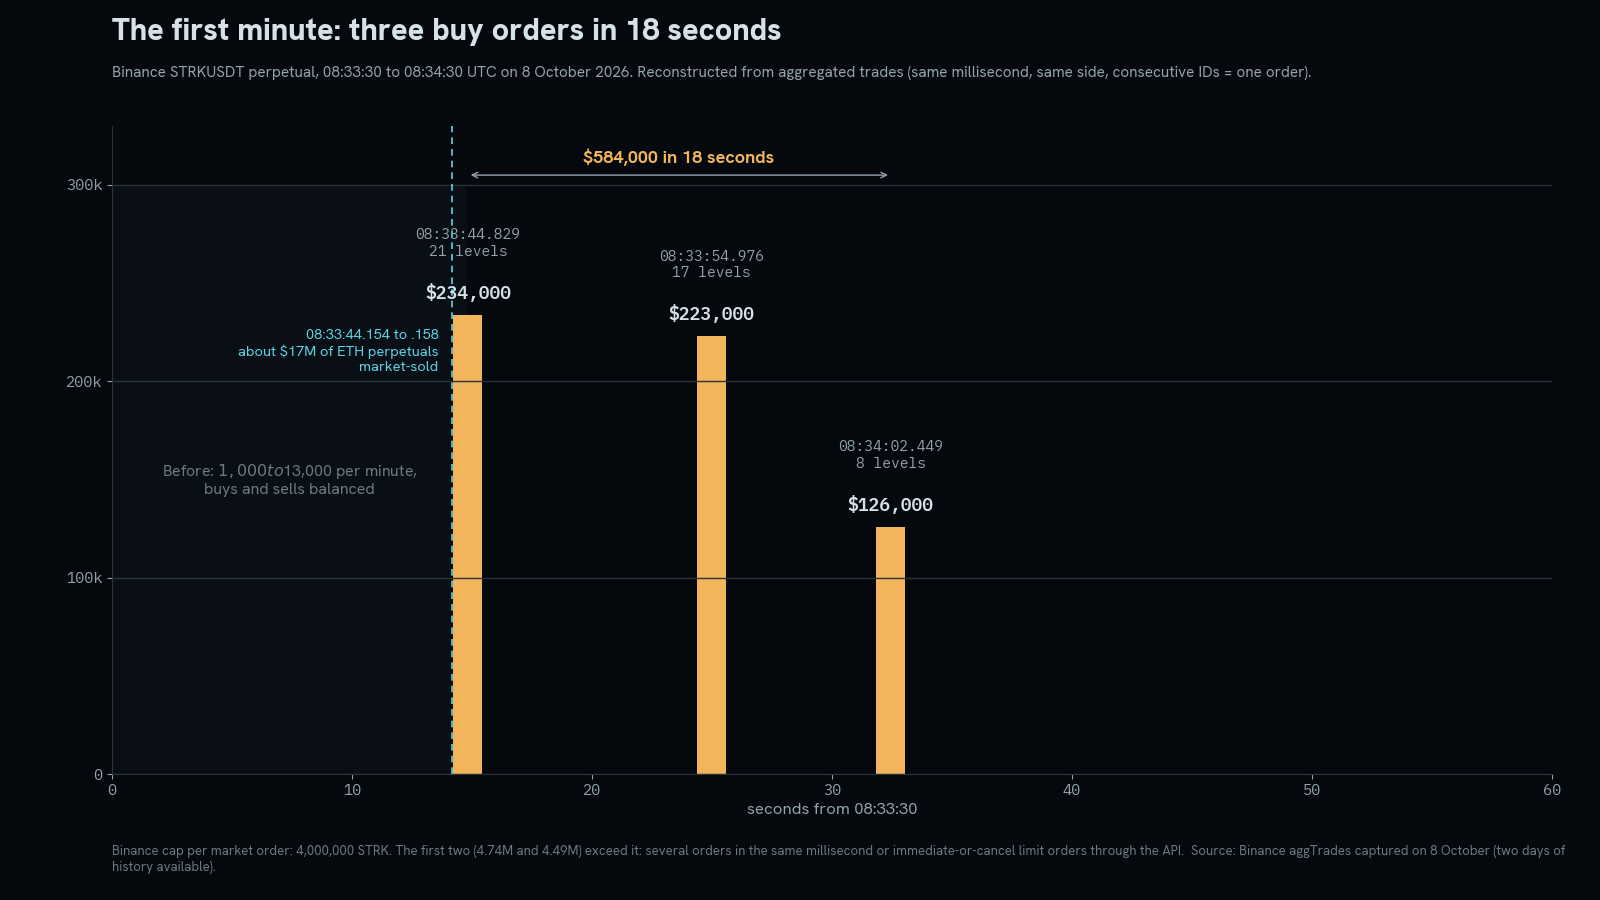
The StarkWare CEO's post on X went out at 08:19. For the next 14 minutes and 44 seconds the Binance STRKUSDT perpetual traded between $1,000 and $13,000 per minute, buys and sells balanced, price flat at $0.0492. On the Binance perpetual, nobody traded the news for a quarter of an hour.
At 08:33:44.829 a buy order of $234,000 swept 21 levels of the book. At 08:33:54.976 another of $223,000 swept 17. At 08:34:02.449 a third of $126,000 swept 8. In total, $584,000 in 18 seconds. Binance caps a market order on this pair at 4,000,000 STRK; the first two were 4.74M and 4.49M, so each was either several orders sent in the same millisecond or immediate-or-cancel limit orders through the API. Either way, in all likelihood automated.
Same side, same style, decreasing size, 10 and 7 seconds apart: the signature of one execution algorithm working an order, not three independent buyers. In the same second, other automated systems market-sold about $17M of ETH perpetuals. Several assets hit by large orders in the same second, after a quiet quarter-hour, is what a headline reaching several automated systems at once looks like.
Hyperliquid publishes its flow, so I reconstructed its blocks: 88 accounts bought aggressively in the first 40 seconds. I classified 87 as market makers or arbitrage bots because in that same hour they were trading dozens of different markets with post-only or immediate-or-cancel orders. One account sent an order from the interface, for $3,400.
How the first day got to 27%
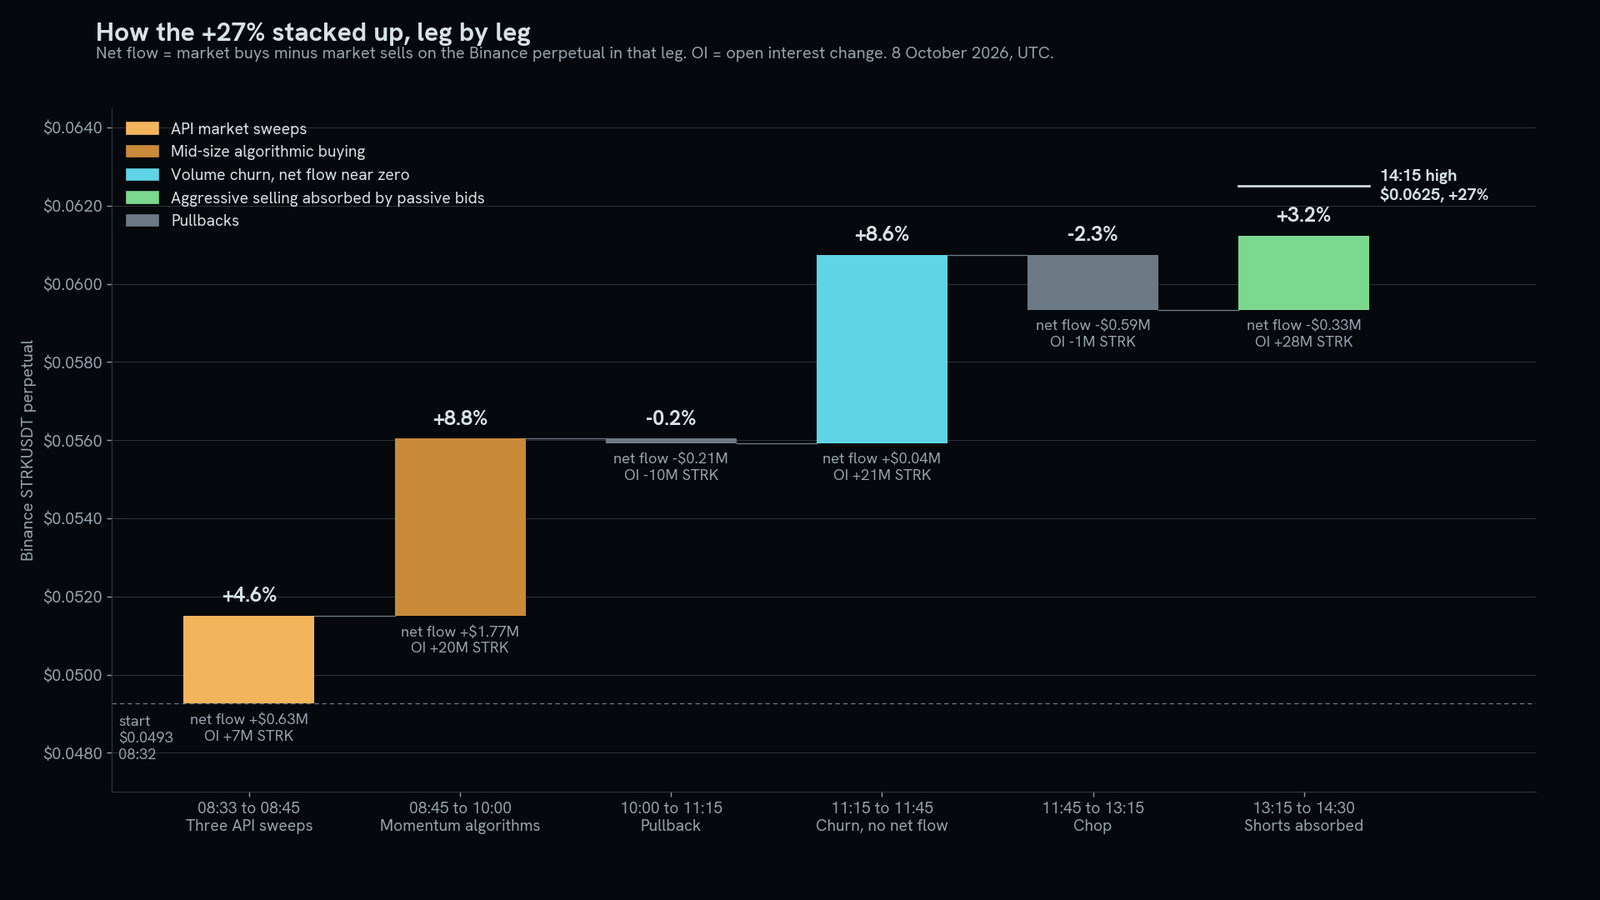
The $584,000 bought about 2%. Another $190,000 sweep at 08:39 took the price to +6%. From 08:45 to 10:00 it rose a further 8.8% on $1.8M of net aggressive buying, concentrated in about 240 orders between $5,000 and $240,000, several milliseconds apart: momentum algorithms, not a crowd. Small orders were net sellers in that window.
Between 11:15 and 11:45 the price rose 8.6% on a few tens of thousands of dollars of net aggressive flow ($9,000 in the exact leg, $40,000 over the full window of figure 3): 21,000 small orders with buys and sells equal to the dollar ($4.32M against $4.31M), and one fixed size, 3,098.5 STRK, printed 114 times and then gone. Volume without capital. The price rose because sellers pulled their quotes, not because anyone bought size.
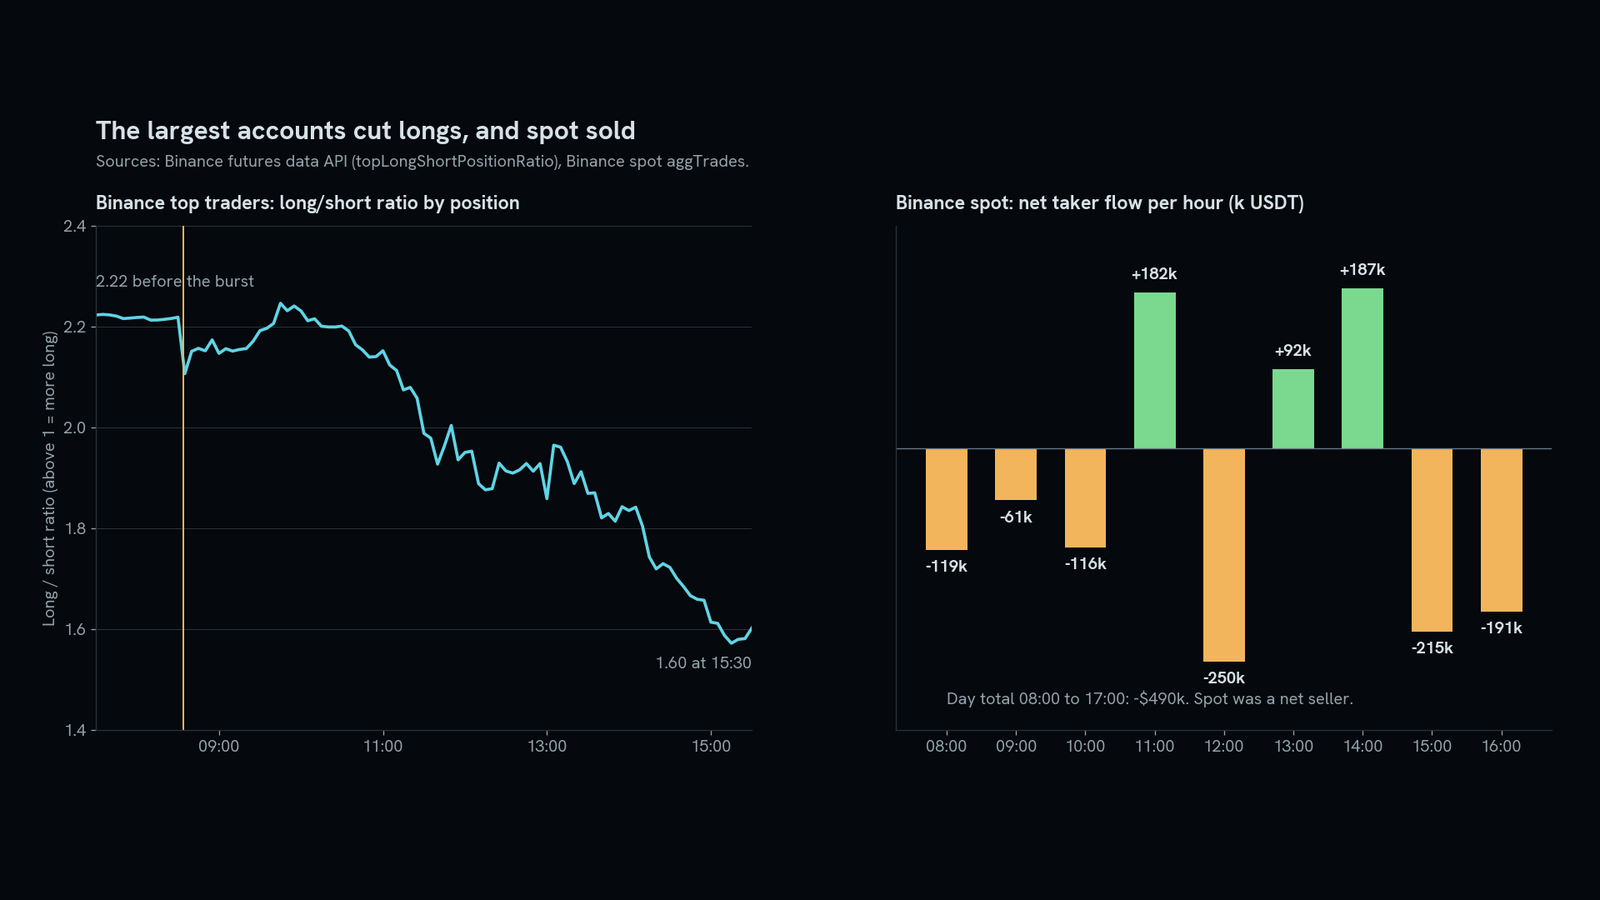
The day's top, at 14:15, was made with net selling and a 28M STRK jump in open interest: shorts absorbed, not buyers. Between 08:00 and 17:00, Binance spot was a net seller by $490,000. Perpetual volume was five times spot volume. Four million dollars of added open interest coincided with $98M of added market capitalisation, computed on circulating supply. With this depth and this share of leverage, a few hundred thousand dollars are enough to move the price appreciably.
9 October: when the crowd arrived
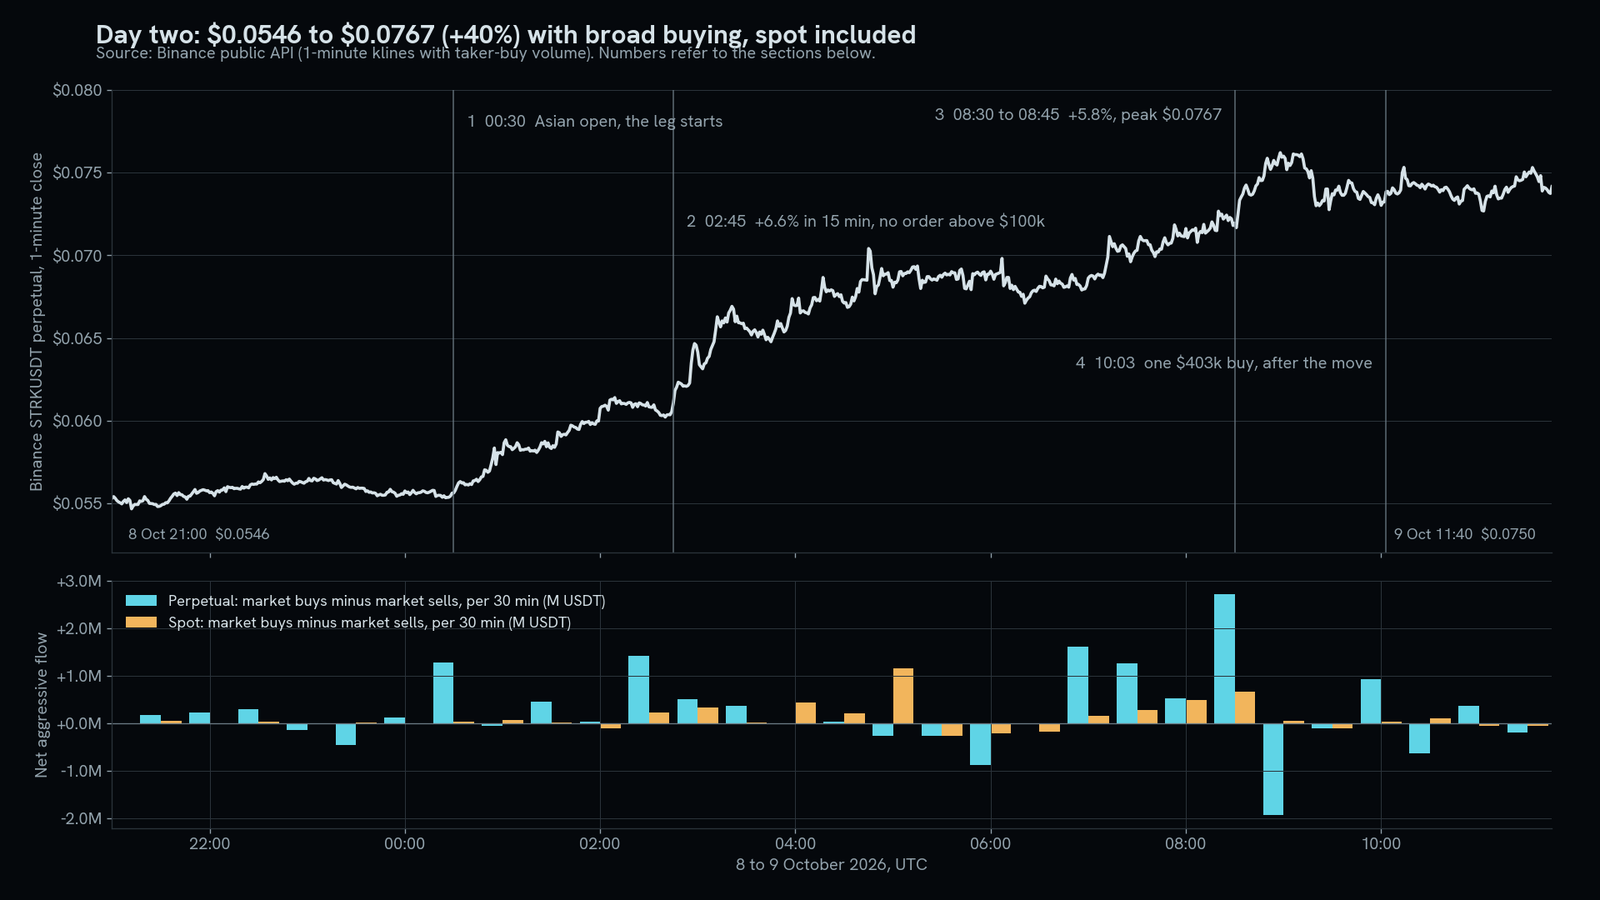
The second day was different and deserves to be said as clearly. The leg began at 00:30, Asian open, with the story already in every outlet. In the 02:40 to 03:05 window there were 15,615 orders and none above $100,000; the sharpest 15 minutes rose 6.6%. The imbalance came from the middle of the distribution: about 255 orders between $5,000 and $100,000 account for $1.3M of net buying.
Binance spot was a net buyer by $3.65M, against $490,000 of net selling the day before. On Bithumb, the Korean exchange, hourly turnover went from 34 million to over a billion won.
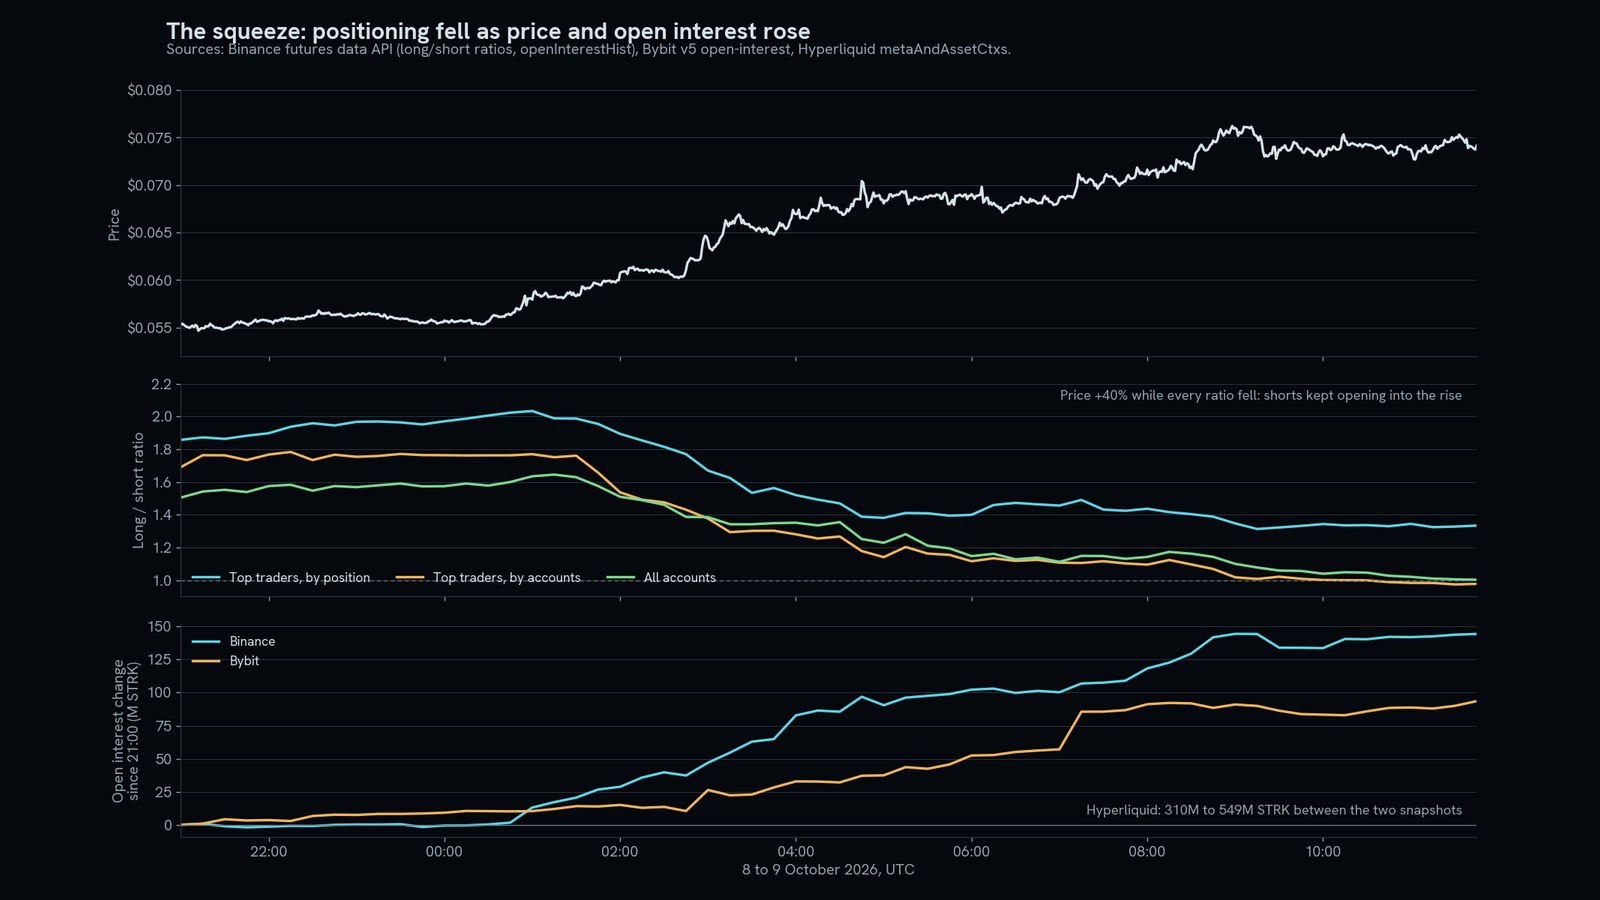
On top of that demand there was a squeeze: open interest rose on Binance, Bybit and Hyperliquid, about $32M of new positions, while the long/short ratio fell. The higher the price went, the more accounts positioned against it, and part of the aggressive buying in the strongest candles probably included forced covering. This was speculative demand in the ordinary sense, unlike the automated start of the 8th, and it deserves to be described as such.
The fall: short at the top, long at the bottom
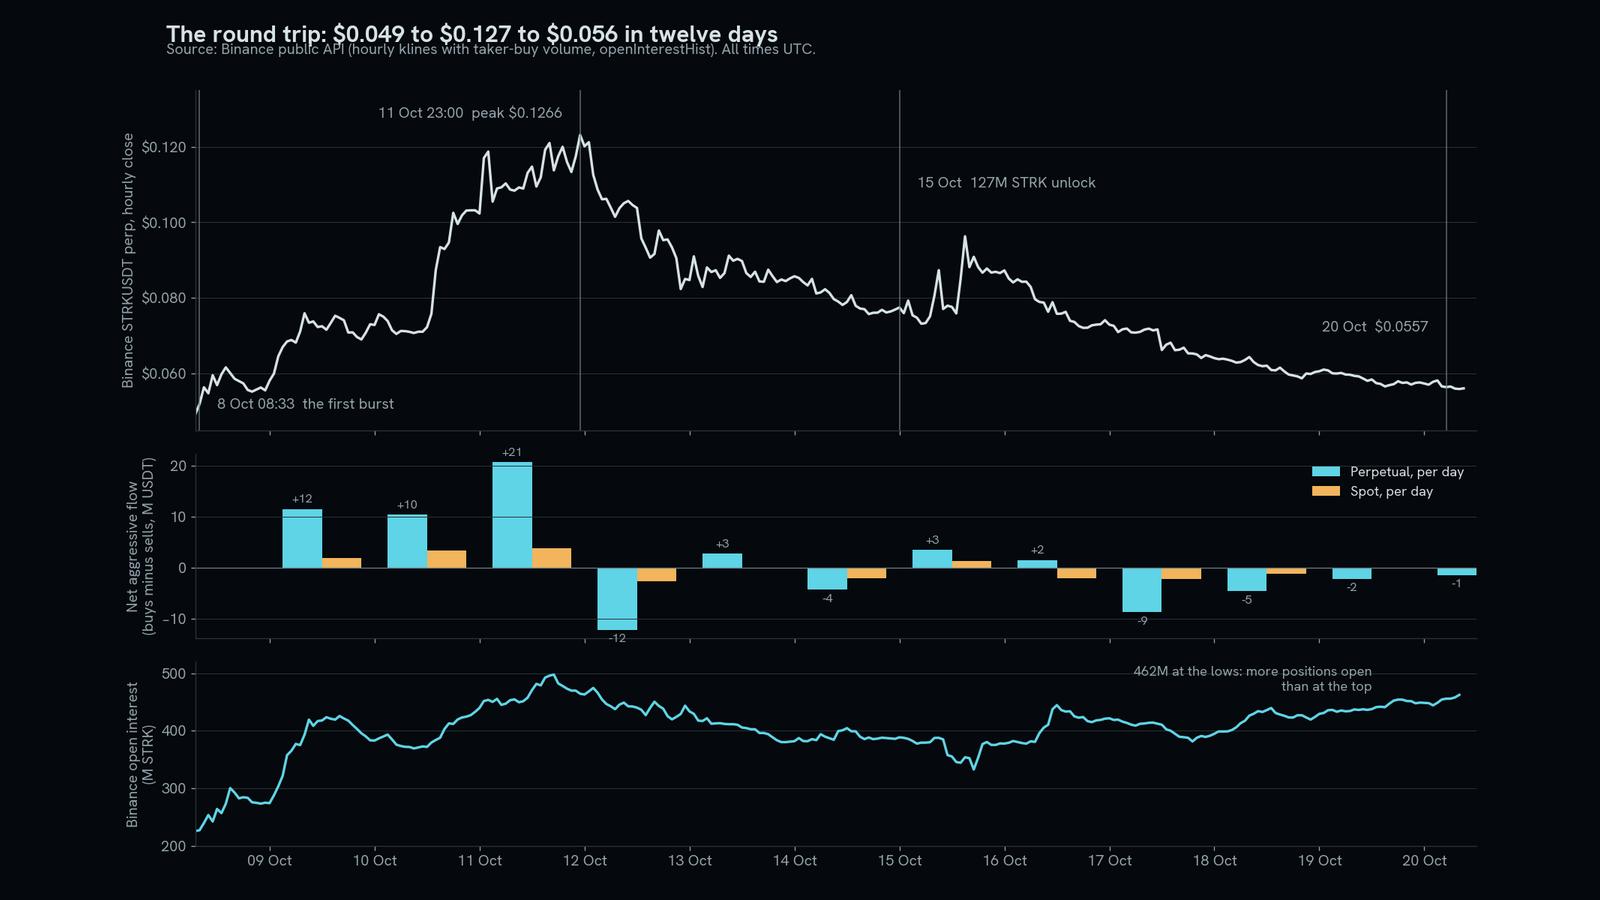
Three days up, nine down. Net aggressive buying on the Binance perpetual was $42.6M between the 9th and the 11th, and about minus $25M over the nine days that followed. Binance open interest went from 274M STRK on the 9th to 498M at the top, and at the close of this analysis stood at 462M, near the window's maximum, at less than half the price. On Hyperliquid it went from 310M to 659M, its maximum. The market did not leave; it is still fighting.
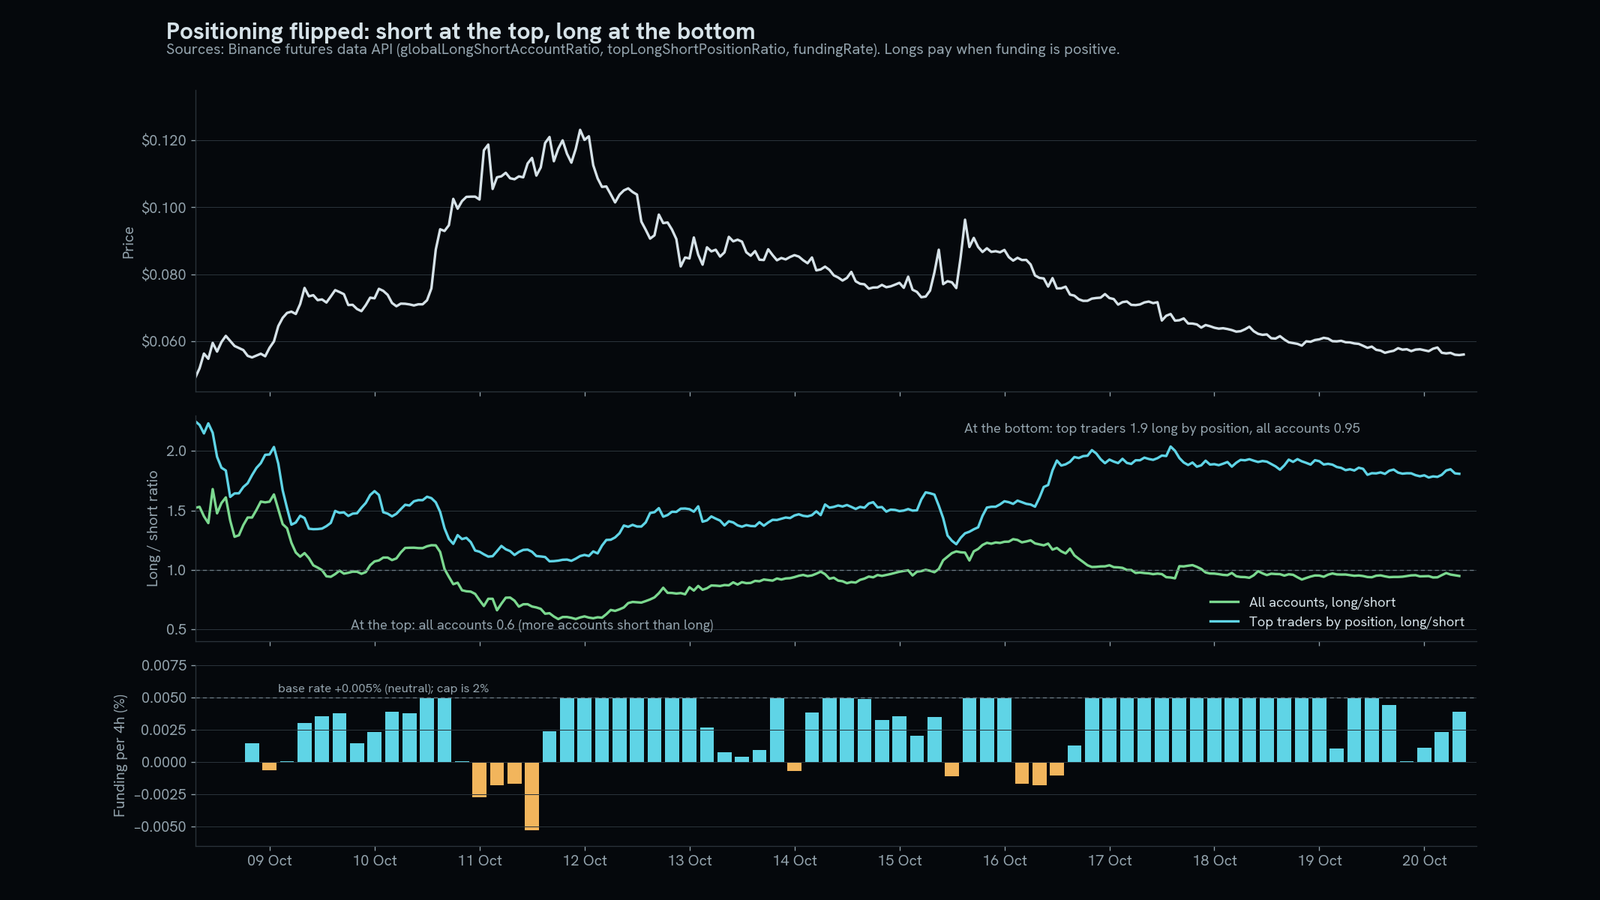
The clearest signal is who was positioned where. On 11 October, with the price above $0.11, the long/short ratio across all Binance accounts fell to 0.6: five short accounts for every three long ones. The crowd was selling the top, and the squeezes that produced the last 20% are consistent with those accounts being run over. Then it inverted: on the way down, the top traders' position ratio climbed from 1.1 to 1.9 and open interest kept growing. Dip buying with leverage, which is what makes a decline grind rather than snap.
The 15 October unlock of 127M STRK, 1.3% of supply, has a bad reputation and a small role: the price had already fallen from $0.1266 to $0.072 in the early hours of the 15th, before the tokens could move, and it rose 25% intraday that same day before fading. It added supply to a market that was already unwinding; it did not start it. A contribution afterwards cannot be excluded. Bitcoin and Ether moved between 1% and 3% over those twelve days: this was not the market.
The supply that reached the exchange
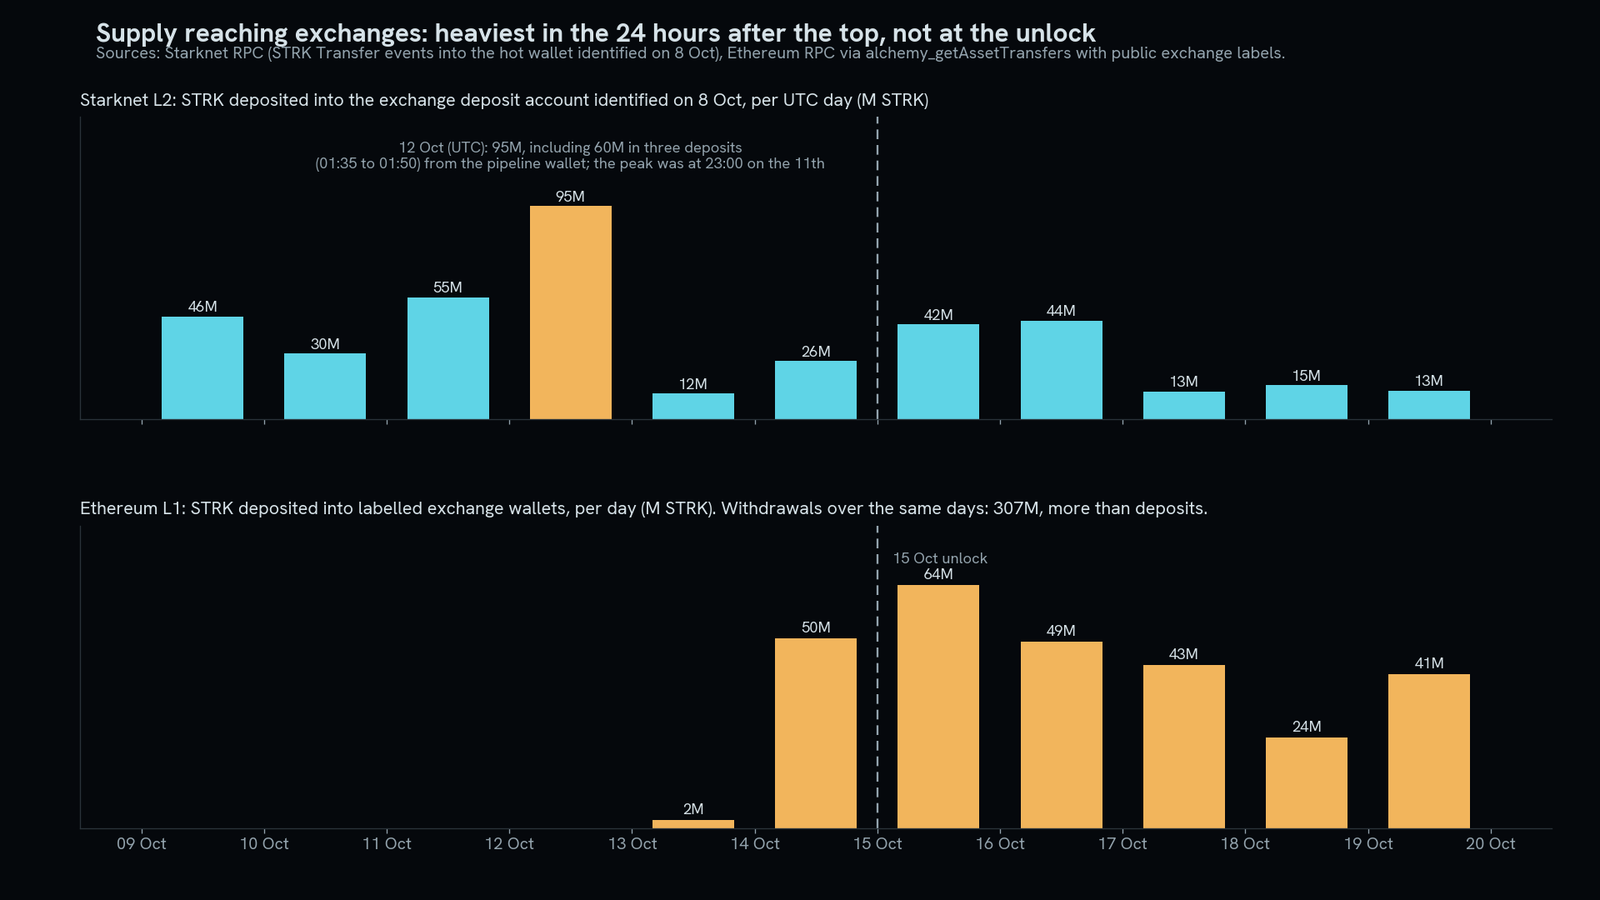
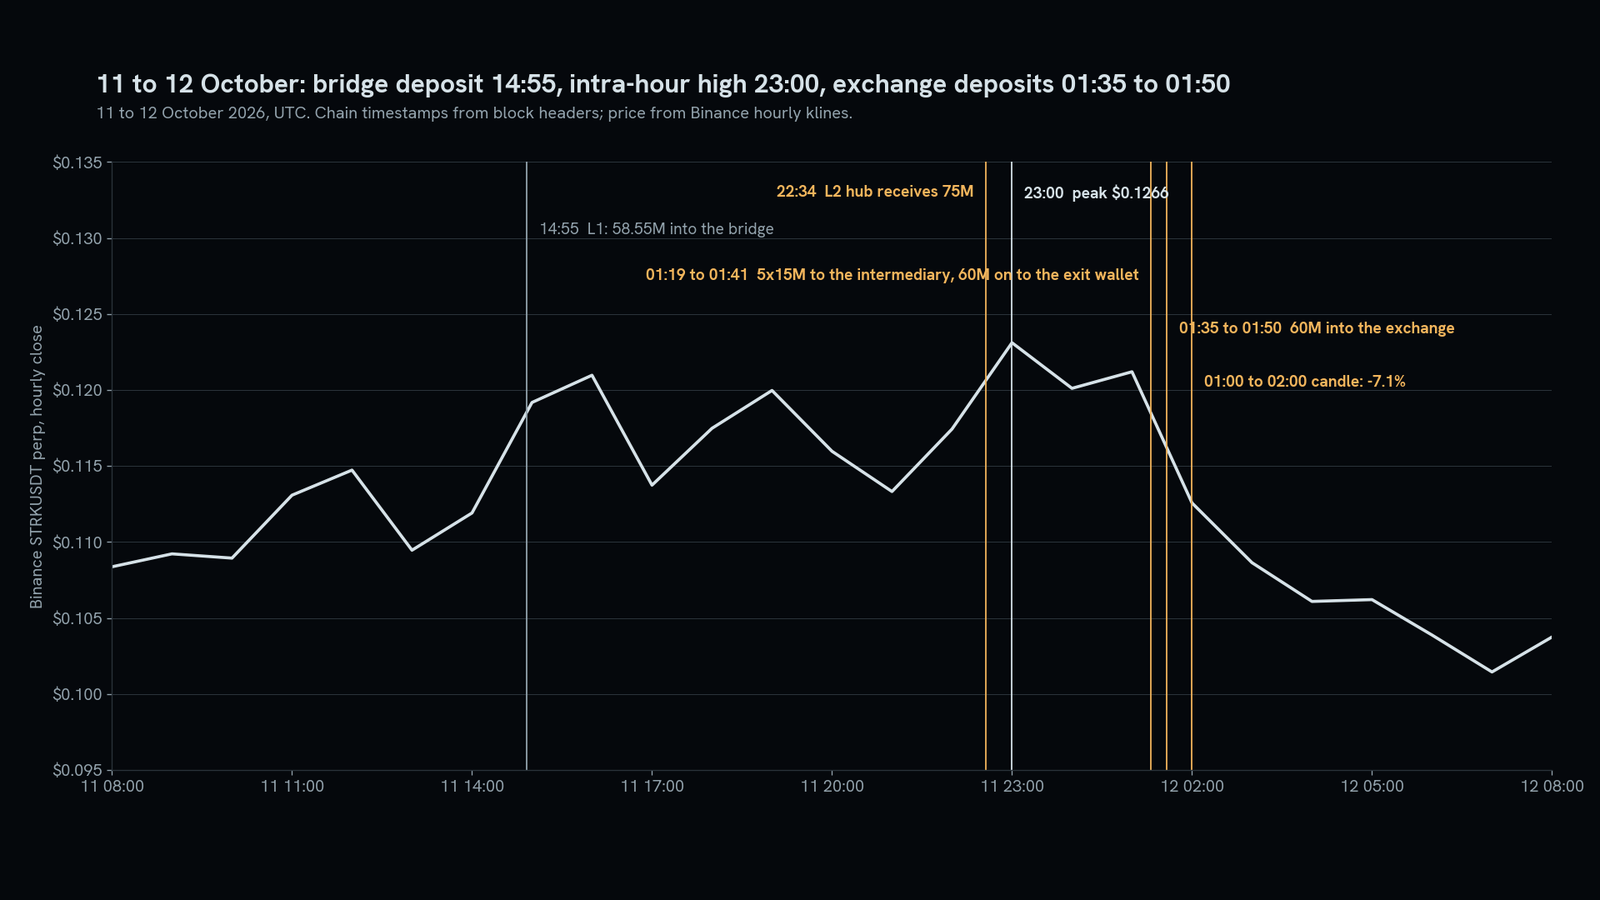
On Starknet, exchange deposits land in accounts that can be watched. The account I identified on 8 October has 192,000 transactions, receives from hundreds of different origins and periodically sweeps everything it receives into a larger account: that is the pattern of an exchange omnibus account, and that is how I attribute it, with medium certainty, because no public register labels it. It received 46M STRK on the 9th, 30M on the 10th, 55M on the 11th and 95M on the 12th, in UTC days. The intra-hour high was the 23:00 candle on the 11th; in the 24 hours that followed, 90.5M arrived, the heaviest window of the whole period, and not the unlock's.
Of that total, 60M arrived in three deposits between 01:35 and 01:50 on the 12th, from an Argent wallet that had received 60M in four chunks of 15M between 01:32 and 01:41 from an Ethereum-key-controlled account, which had itself received 75M in five chunks of 15M between 01:19 and 01:25 from an account I will call the Starknet hub. In that same hour, 01:00 to 02:00, the price fell 7.1% on Binance. As the receiving exchange is not identified, the coincidence does not allow the fall to be attributed to these deposits.
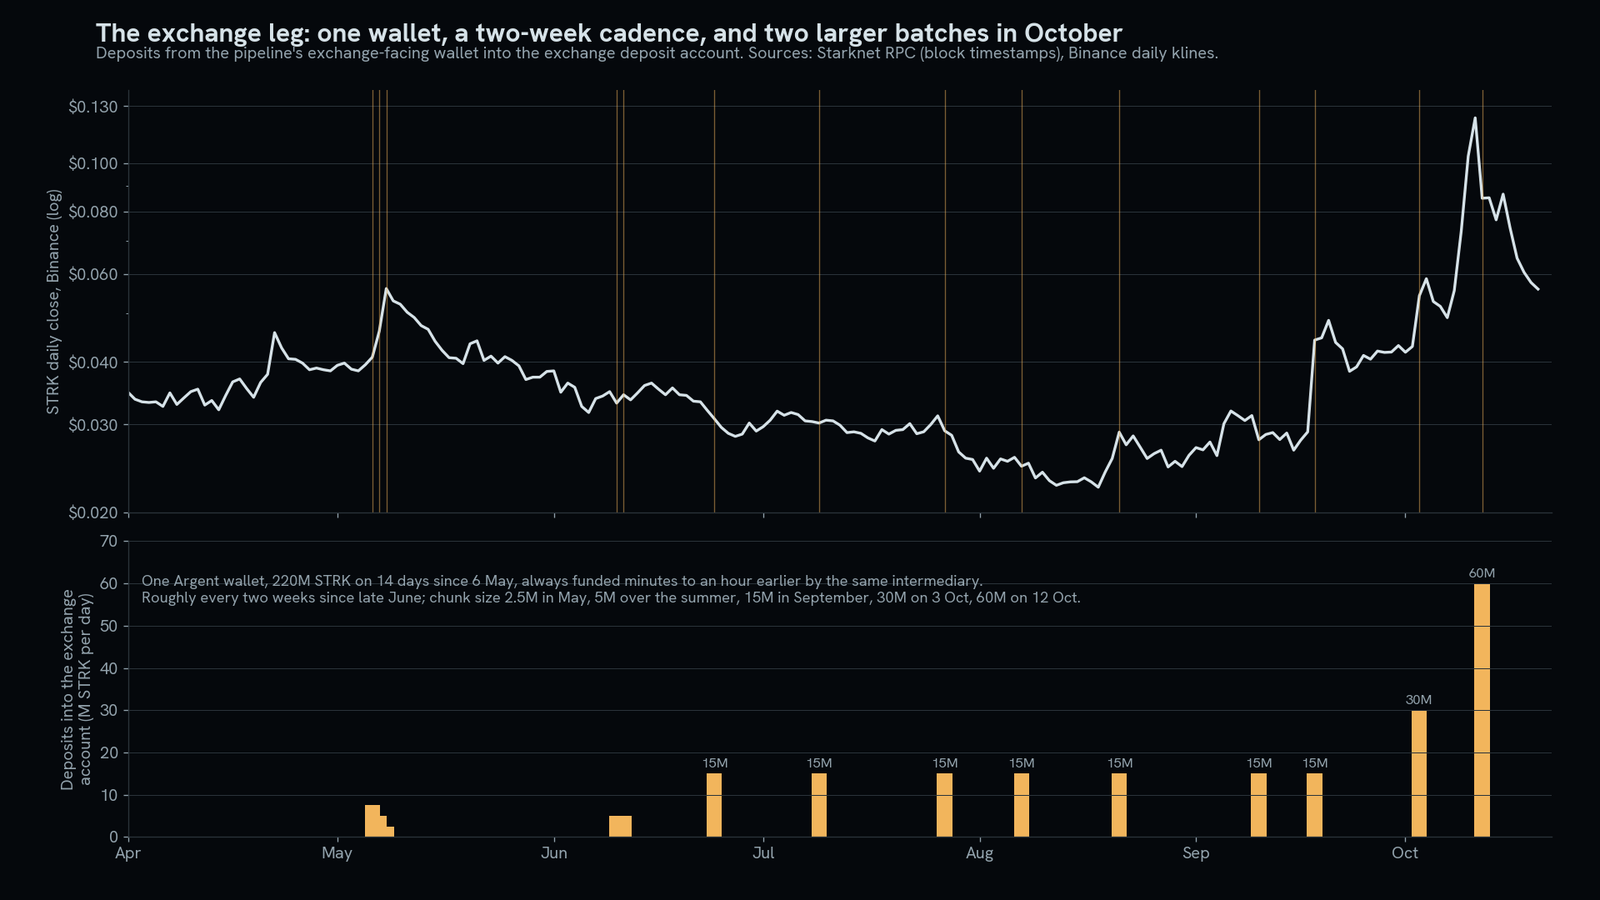
That Argent wallet is not new: it has deposited into the same account on 14 days since 6 May, 220M STRK in total, always funded by the same intermediary minutes earlier, at a roughly fortnightly cadence since late June. The daily total went from 2.5M to 7.5M in May, 15M from late June to September, 30M on 3 October and 60M on the 12th. It is a recurring deposit pattern, and the next section follows it upstream.
Upstream: six hops to the Foundation's allocation
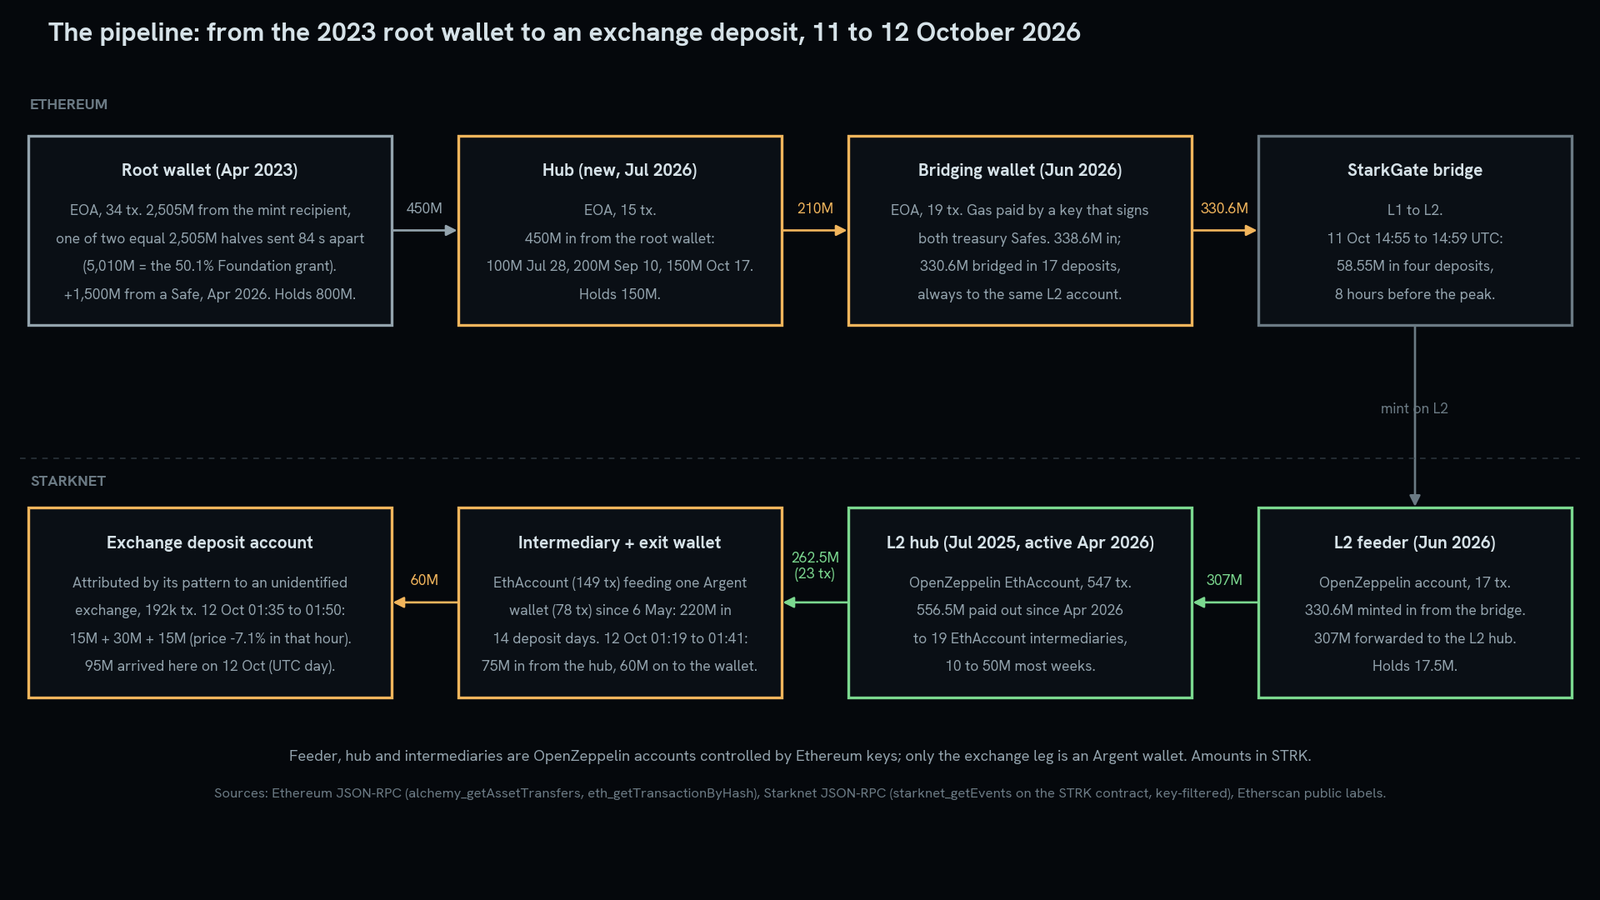
I followed the 60M backwards across the StarkGate bridge and up the Ethereum side, using only the canonical STRK contracts on each chain (0xCa14…2766 on Ethereum and 0x0471…938d on Starknet). That is six accounts and eight transfers, because the bridge is two (a deposit on Ethereum and a mint on Starknet) and the intermediary forwards to the exit wallet. Each transfer is a chain record; attributing some funds to others, where an account mixes inflows, is an inference under the rule I state.
Tracing rule. On Ethereum I apply FIFO: the bridging wallet had received 338.6M (210M from the Ethereum hub and 128.6M from three wallets fed by the treasury Safe) and had sent out 280M before the 11th, so the 58.55M bridged that day correspond entirely to the 110M the hub sent it on 16 September, which in turn came from the root wallet's 200M payment of 10 September.
On Starknet the feeder, into which the bridge always mints what that wallet deposits, passed 75M to the hub: 58.55M from that day and 16.45M from earlier mints of the same bridging wallet. For the last two hops I apply the last-batch rule: the 60M left the intermediary seven minutes after it received the 75M, and it had no other inflows that day.
The 2023 wallet is where the trail ends. On 2 April 2023 the account that received the entire 10 billion STRK mint sent it 2,505M, and 84 seconds later sent another 2,505M to a second wallet. Together that is 5,010M: 50.1% of the supply, exactly the share that StarkWare's token design of July 2022 allocated to the Starknet Foundation. I attribute it, with high certainty but by inference, to the Foundation's allocation because of that arithmetic and date match; I know of no public label that confirms it. The second half later moved into a multisig Safe, and in April 2026 that Safe topped the first wallet up with another 1,500M. I will call it the root wallet.
| Step | Account | Transfer | When | Grade |
|---|---|---|---|---|
| 1 | Root wallet 0x10e5…bf0f (Ethereum) | Sends 200M to the Ethereum hub; had received 2,505M from the mint recipient on 2 April 2023 | 10 Sep 2026 | Fact; attribution to the Foundation: high-certainty inference |
| 2 | Ethereum hub 0x4a34…439a | Sends 110M to the bridging wallet (out of the 200M received on 10 September) | 16 Sep 2026 | Fact; FIFO assignment: high-certainty inference |
| 3 | Bridging wallet 0xa8a5…0586 | Deposits 58.55M into StarkGate in four operations; its ETH for gas was sent on 22 June by an address that is an owner of both treasury Safes | 11 Oct, 14:55 to 14:59 | Fact; link to the Safes: recorded fact (getOwners) |
| 4 | Starknet feeder 0x0f27…0f30 | The bridge mints 58.55M into the feeder | 11 Oct, 14:59 to 15:02 | Fact |
| 5 | Starknet hub 0x0769…96b5 | Receives 75M from the feeder in five chunks of 15M (58.55M from that day and 16.45M from earlier mints) | 11 Oct, 22:34 to 22:38 | Fact; batch mixing: high-certainty inference |
| 6 | Intermediary 0x047f…7cee | Receives 75M from the hub in five chunks of 15M | 12 Oct, 01:19 to 01:25 | Fact |
| 7 | Exit wallet 0x02b9…7180 (Argent) | Receives 60M from the intermediary in four chunks of 15M | 12 Oct, 01:32 to 01:41 | Fact; last batch: high-certainty inference |
| 8 | Deposit account 0x0213…32a2d | Receives 15M, 30M and 15M from the exit wallet | 12 Oct, 01:35 to 01:50 | Fact; attribution to an exchange: medium-certainty inference |
A treasury, not a vesting contract
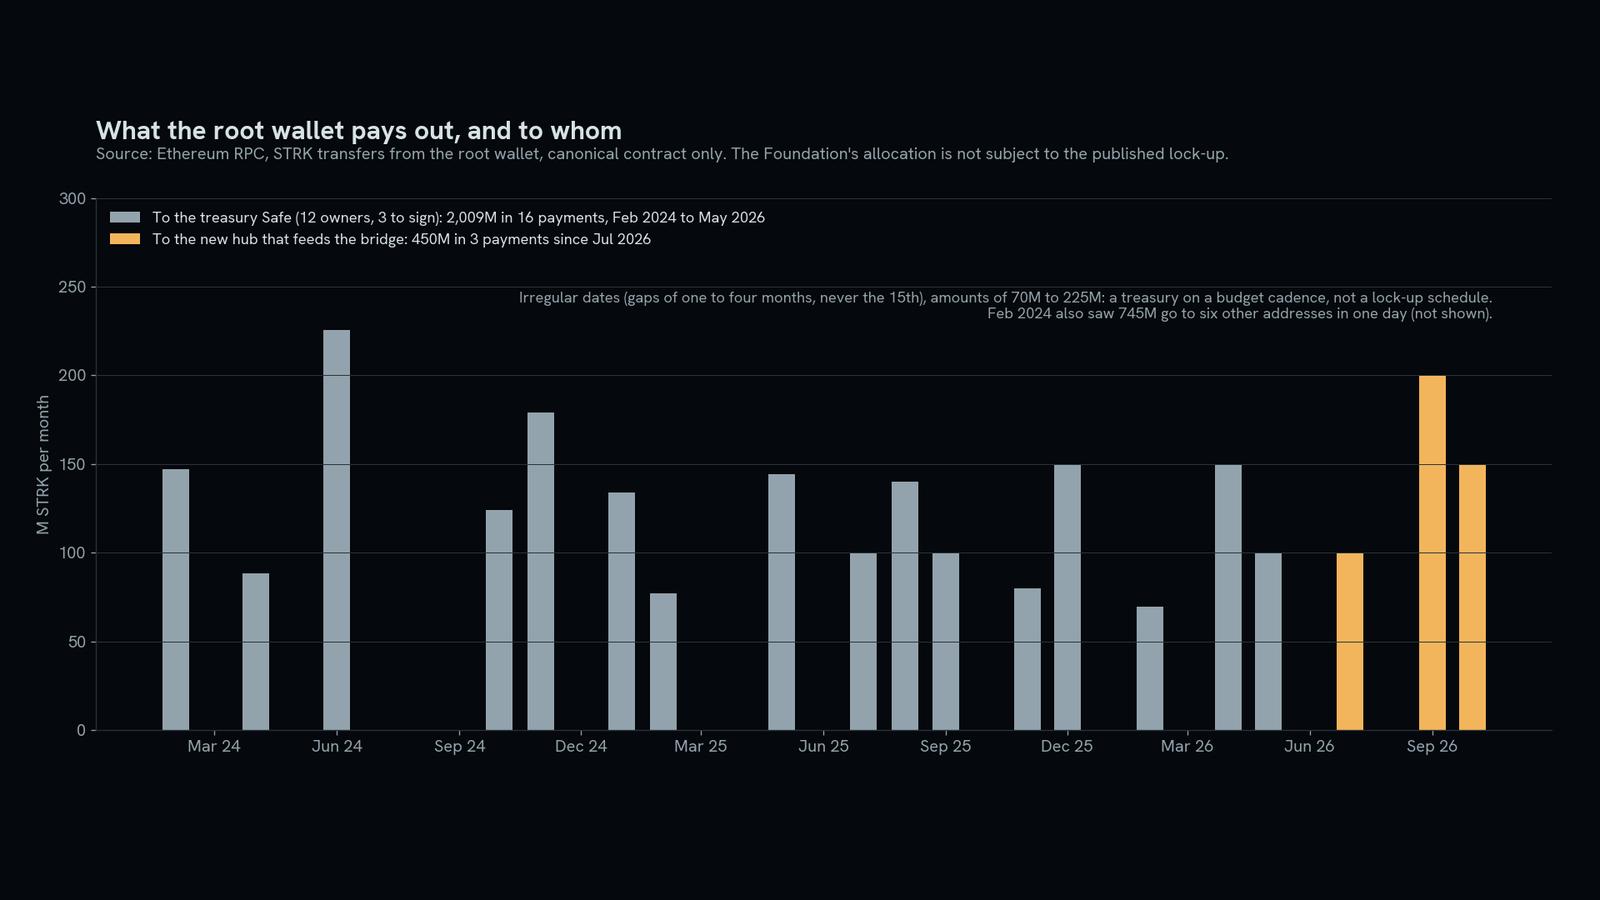
The root wallet behaves like a treasury: since February 2024 it has paid 2,009M in sixteen transfers to a twelve-owner Safe, at irregular intervals, one to four months and never on the 15th, which is unlock day, in amounts between 70M and 225M. In February 2024 it also sent 745M to six other addresses in a single day, not shown in figure 12; with that, its current balance of 800M reconciles.
The Foundation's allocation is not subject to the published lock-up, so there is no schedule to follow. In July 2026 a new recipient appears: the Ethereum hub, which has received 450M in three payments, of which 210M went, traced, to the bridging wallet, 90M went directly to the bridge on 16 September and 150M remain in it.
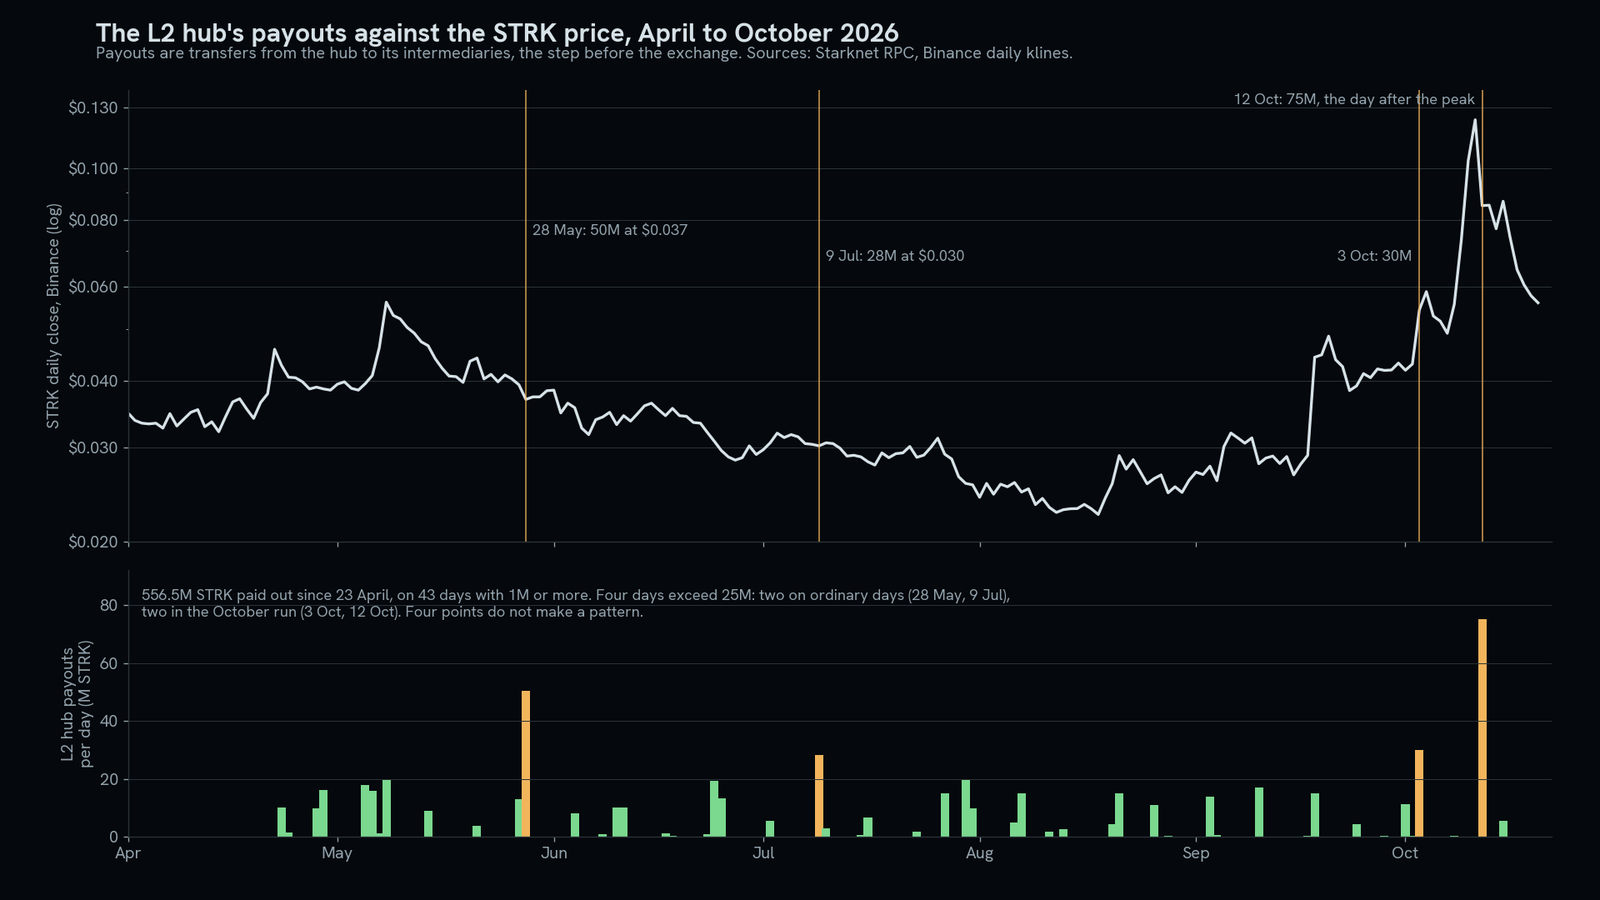
On the Starknet side, the hub has paid out 556.5M STRK since 23 April, on 43 days with a payout of 1M or more, to nineteen programmatically created intermediaries. By direct tracing, at least 256M reached the deposit account, 220M of it through the exit wallet described above; 50M went to the staking contract and 10.7M to the AVNU router. Only the feeder leg, 307M, is traced back to the root wallet in this analysis; the hub's other inflows are not followed here.
Four days exceed 25M: 50M on 28 May, at $0.037; 28M on 9 July, at $0.030; 30M on 3 October, at $0.054; and 75M on 12 October, at $0.085 daily close. Two on ordinary days, two in the October episode. Four points do not make a pattern and I am not claiming one. The October batch took eleven hours from the bridge deposit to the deposit account. In the earlier batches there is no one-to-one match between mint and deposit: the feeder and the hub held inventory, and the exit wallet's deposits came days or weeks after each mint. October's is the only batch that travels the whole route within the same day.
What this says and what it does not
It says that the largest deposit into the account attributed to an exchange in the 24 hours after the peak was supply traceable, under the stated rule, to a wallet I attribute to the Foundation's allocation, routed through a path that has been in use for six months. It says that the wallet which, in what I observed, deposits into the bridge towards the feeder received its ETH for gas from an address that is an owner of both treasury Safes; signing on a Safe does not imply deciding these operations, and no conduct is attributed to that address.
Who operates the Starknet-side accounts, I do not know. It says that the throughput is large: the hub paid out 556.5M since April, and of that 307M, 3.1% of supply, is traced here to the root wallet.
It does not say that the Foundation sold. A deposit into an exchange is not a sale; the account could belong to a market maker holding borrowed inventory, an OTC desk, a custodian, or the Foundation itself. As the receiving exchange is not identified, the Binance flow in those hours (about 23M STRK of net selling between 01:00 and 03:00) neither confirms nor rules out a sale. Nor do the data allow one to know whether the timing was chosen for the price: the October batch was the largest, but four points do not distinguish a market decision from an internal calendar.
And it does not say that anything is improper. The Foundation's 50.1% includes buckets meant to be handed out (community provisions, rebates, grants, donations), so treasury-origin tokens reaching an exchange can be the last step of a distribution as much as a treasury action. The programmatic accounts and the signer-paid gas are compatible with an operation by the treasury or on its behalf, for example with a market maker, and also with other explanations. They are a technical link; they do not prove who decides or for what. I have found no public report that reconciles these flows; my search was not exhaustive, and I say so.
MSDI: a 0 to 100 score that compares projects on the same terms
Analysing one case by hand only answers that case. To compare projects on equal terms, each one is scored with an algorithm that combines quantitative metrics, computed from public data only, into a single score from 0 to 100. We call that set of checks the Market Structure and Disclosure Index, MSDI. It measures how a token's price is formed (leverage, automation, participation), where the supply that reaches exchange deposit accounts comes from, and how much of that the issuer has made reconcilable. It does not judge intent and it is not investment advice. A low score indicates that a larger part of what is observed cannot be explained or reconciled with public data; it does not indicate misconduct by the issuer.
The algorithm applies the same metrics and weights to every project across four pillars (price formation, participation, supply provenance and disclosure), and reports an uncertainty band and a coverage percentage alongside the score: what cannot be measured from public data is not scored, so the result never rests on guesses. The current version is provisional until it is calibrated against comparable projects. The evidence file behind each score is kept with its SHA-256 fingerprint, 19a38b66ba855693796ecdbade7971b7d60b5f36695606dc88d94bd3ea48ffde, as a guarantee of integrity.
Starknet, October 2026: 37.5 out of 100, band 26 to 56, coverage 0.73 of the weight scored. Price formation 37.5; participation 43; supply provenance 23; disclosure 80, with one indicator of three assessed, because the allocation and unlock documents exist and match the chain, while treasury reporting and liquidity disclosure remain unassessed. The next chapters of this series will apply the same index to other projects.
Method, scope and limits
I reconstructed orders from Binance aggregated trades (same millisecond, same side and consecutive IDs equal one order); net aggressive flow comes from taker volume; open interest, positioning ratios and funding from the futures data API. Hyperliquid blocks were reconstructed from its public explorer. STRK transfers were queried only on the canonical contracts; an earlier draft used an unfiltered query and picked up two transfers of look-alike tokens, which were removed. Timestamps are block-header timestamps, not explorer labels.
This is an analysis based on public on-chain and market data. Relationships between addresses are inferences with their degree of certainty stated in the table and the text: traceable to the Foundation's allocation means traceable by transfers, under the stated FIFO rule, to the wallet that received one of the two 2,505M halves, and does not mean I know who signs for any downstream account. No unlawful conduct is attributed to any person or entity. This is not a forensic expert report and not investment advice.
This analysis was not commissioned or paid for by anyone. I work as a data engineer at MigaLabs, an Ethereum research lab. I have no relationship with StarkWare, the Starknet Foundation or the exchanges cited, and no position in STRK, neither at the date of publication nor during the period analysed.
Whoever controls any of the accounts described can provide context or point out errors at info@peritojudicialinformatico.org. I will publish the response and date-stamp any correction.
This is the first chapter of this series of on-chain analyses of projects and tokens. More chapters will follow with the same method and the same index. A trace of this kind, documented as an expert report, carries a chain of custody, a stated degree of certainty and ratification; how that is done is described in the cryptocurrency tracing and wallet and exchange expert services.
Frequently asked questions
Short answers to common questions.
Was it a rug pull?
Not in the usual sense of the term: no liquidity was removed, volume is still hundreds of millions a day and open interest is near the window's maximum. What the chain shows is a recurring route of treasury-origin transfers into an account attributed to an exchange, whose purpose cannot be determined from public data.
Are those funds linked to the Foundation?
Yes. Eight transfers recorded on-chain take the 60 million from the wallet that received one of the two halves of the Foundation's allocation in 2023 to the deposit account, and the gas for the wallet that moved them across the bridge was paid by a signer of the treasury Safes. What is inference is graded in the table: that this wallet belongs to the Foundation (high certainty), which tokens leave when an account mixes inflows (high) and that the destination is an exchange (medium).
Do the data show that the Starknet Foundation sold?
They show the deposit, not the sale. A deposit into an exchange account is not a sale, the exchange is not identified, and the Binance flow in those hours neither confirms nor rules out a sale.
What started the 8 October rise?
Three buy orders in 18 seconds, in all likelihood automated and sent through the API, 14 minutes and 44 seconds after the post, for $584,000, followed by momentum algorithms and a perpetuals market five times larger than spot.
Did the 15 October unlock cause the fall?
It did not start it: the price had fallen from $0.1266 to $0.072 before that date and rose 25% intraday on unlock day. A contribution afterwards is not excluded.
What is the MSDI index and what does a 37.5 mean?
The name we give to a set of checks that scores market structure and disclosure from 0 to 100, using public data only. A 37.5 with a 26 to 56 band describes a market dominated by leverage and automation, with treasury-origin supply reaching an account attributed to an exchange and no public reconciliation found. It does not indicate misconduct and is provisional until calibrated on comparable projects.
Can the data be checked?
Yes. The sources are public and need no key: the Binance, Bybit and Bithumb APIs, the Hyperliquid explorer, and Ethereum and Starknet RPC nodes with the canonical STRK contracts. Every address, transaction and method is in the sources section with what it proves. The scoring index is a proprietary system and its methodology is not published; I keep the evidence file with its SHA-256 fingerprint.
Sources
Data, addresses and documents cited in the analysis.
- Starknet token design (StarkWare, 13 July 2022): 50.1% to the Foundation, 32.9% to contributors, 17% to investors
- STRK unlock schedule (docs.starknet.io)
- Transfer of 2,505M from the mint recipient to the root wallet, 2 April 2023
- Transfer of 2,505M from the mint recipient to the second wallet, 84 seconds later
- Root wallet on Ethereum: payments to the treasury Safe and to the hub
- Ethereum hub: 450M received from the root, 210M to the bridging wallet and 90M to the bridge
- Bridging wallet: StarkGate deposits, including the four on 11 October
- 0.01 ETH gas transaction to the bridging wallet, 22 June 2026, from the address that is an owner of the Safes
- Treasury Safe with twelve owners and threshold three (check with getOwners)
- Safe holding the second half, eight owners and threshold four
- STRK StarkGate bridge on Ethereum
- Feeder on Starknet, into which the bridge mints what the bridging wallet deposits
- Starknet hub: 556.5M paid to 19 intermediaries since April 2026
- Intermediary that receives the five 15M chunks on 12 October
- Exit wallet (Argent): 220M deposited on 14 days since 6 May
- Deposit account attributed to an unidentified exchange (192,000 transactions)
- Canonical STRK contract on Starknet
- Hourly candles of the Binance STRKUSDT perpetual from 8 October (field 10: taker buy volume)
- The three 08:33 orders, Binance aggregated trades (two days of history available; captured on 8 October)
- 4,000,000 STRK cap per market order (MARKET_LOT_SIZE in exchangeInfo)
- Binance open-interest history
- Binance long/short ratio across all accounts
- Binance top-trader long/short ratio by position
- Binance funding rate
- Bybit open interest
- Bithumb hourly candles (KRW-STRK)
- Hyperliquid explorer (blocks 1176056536 to 1176057172)
Related services
If your case fits, this is the expert work I do.
- Crypto tracingBTC, Ethereum, L2s and USDT to the exchange
/en/crypto-tracing - Wallets and exchangesAddress attribution and statements
/en/wallet-exchange-attribution - Crypto forensics expertAll blockchain services
/en/crypto-forensics-expert
Related articles
- El exploit de KelpDAO explicado para abogadosQué pasó, cómo se siguieron los fondos hasta Bitcoin y qué enseña para casos reales.
/blog/kelpdao-exploit-explicado - Falsas empresas de recuperación de criptomonedasLas señales de la segunda estafa y lo que de verdad puede hacer un perito.
/blog/empresas-recuperacion-criptomonedas - Drainers: cómo se demuestra qué firmasteApprove, permit y setApprovalForAll: qué rastro deja cada firma y cómo se prueba.
/blog/drainers-firmas-maliciosas
Tell me about your case
Free 30-minute consultation and a free quote within 24 working hours.